Parsing data from pcaps
On Sunday I set up some quick and dirty temperature monitoring. At that point I didn't have any server code lying around to recieve the readings from the sensors. I set up tcpdump on a fileserver to capture the packets, tcpdump has the benefit of loggin a timestamp with each packet helping me get around limitations of the nodemcu hardware.
A day later I have to try and process the pcap files.
$ tcpdump -A -r temperaturevalues.pcap-1 | head -n 4
reading from file temperaturevalues.pcap-1, link-type EN10MB (Ethernet)
12:20:55.766057 IP 10.4.4.160.4097 > 10.4.4.187.acmsoda: UDP, length 134
E...........
...
......9....[{"humditiy": 47, "temp": 23, "pin": "Pin(4)", "sensor": "Pin(4)"}, {"humditiy": 45, "temp": 21, "pin": "Pin(5)", "sensor": "Pin(5)"}]
The -A flag for tcpdump will show me the packet payload as ascii, I was pushing json from the server so this is rather easy to see. I could use some shell magic to pull this out, but I wanted to play with scapy.
Scapy is a python library for dealing with packets, it does everything tcpdump will with packet injection to boot. Scapy will happily take in the pcap files.
#!/usr/bin/env python

from scapy.all import rdpcap
import json

if __name__ == "__main__":
    pcapfiles = [ "temperaturevalues.pcap-1", "temperaturevalues.pcap-2"]

    readings = []

    for files in pcapfiles:
        pkts = rdpcap(files)

        for p in pkts:
            time = p.time
            readings = json.loads(p.load)
            print("%s,%s,%s,%s,%s" %
                (time,
                readings[0]["sensor"],readings[0]["temp"],readings[0]["humidity"],
                readings[1]["sensor"],readings[1]["temp"],readings[1]["humidity"],
                )
            )
Running
$ python process.py > readings.csv
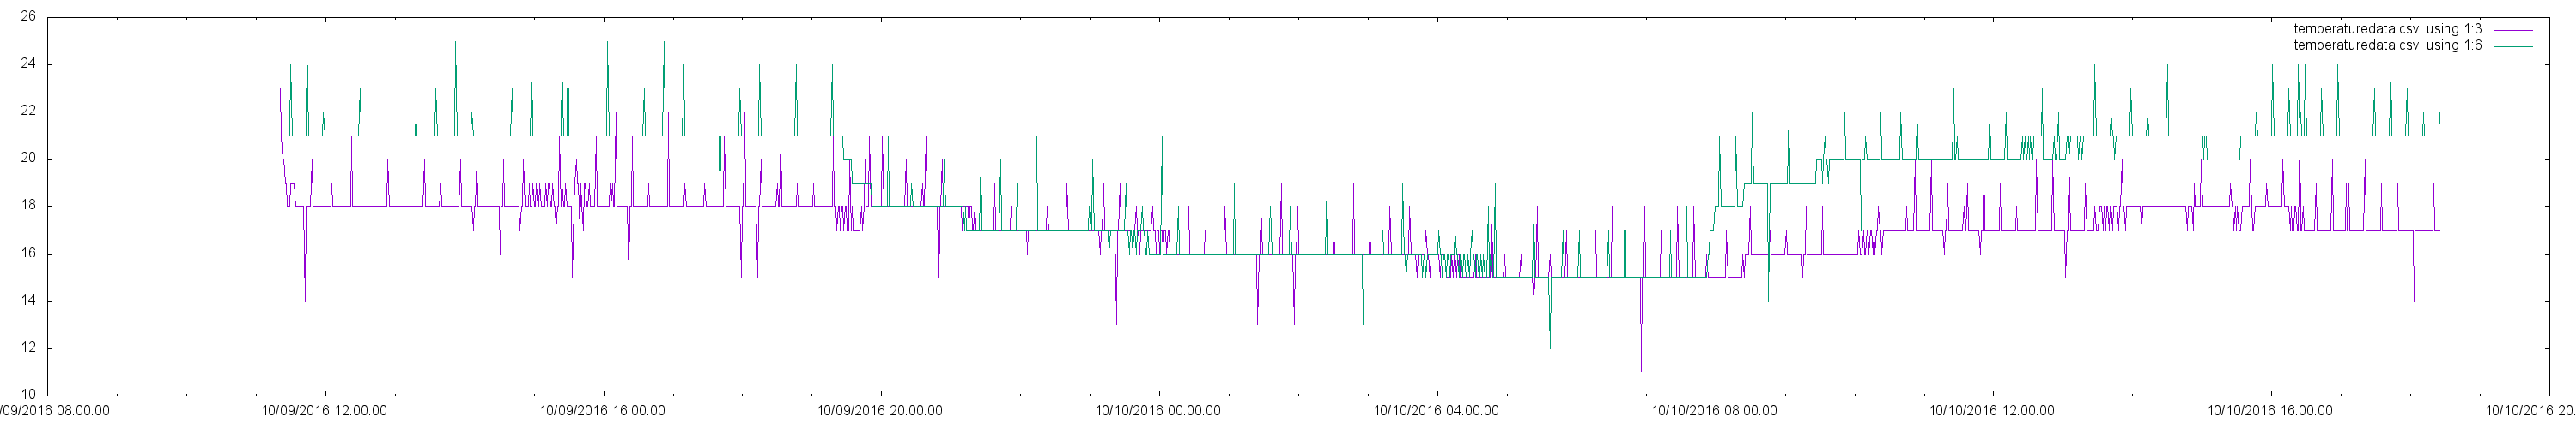
Gives me a csv file with the temperature and humidity data from the sensors. Feeding this to gnuplot with something like the below results in a nice(albeit noisy) plot of the temperature from the two sensors.
set datafile sep ','
set timefmt "%s"
set format x "%m/%d/%Y %H:%M:%S"
set xdata time

set terminal png size 3000,500
set output 'data.png'

plot 'temperaturedata.csv' using 1:3 with lines, 'temperaturedata.csv' using 1:6 with lines